How to debug EventBridge Events with CloudWatch
How to use AWS CloudWatch Logs to view, debug and analyse EventBridge Events.
David Boyne
· 7 min read
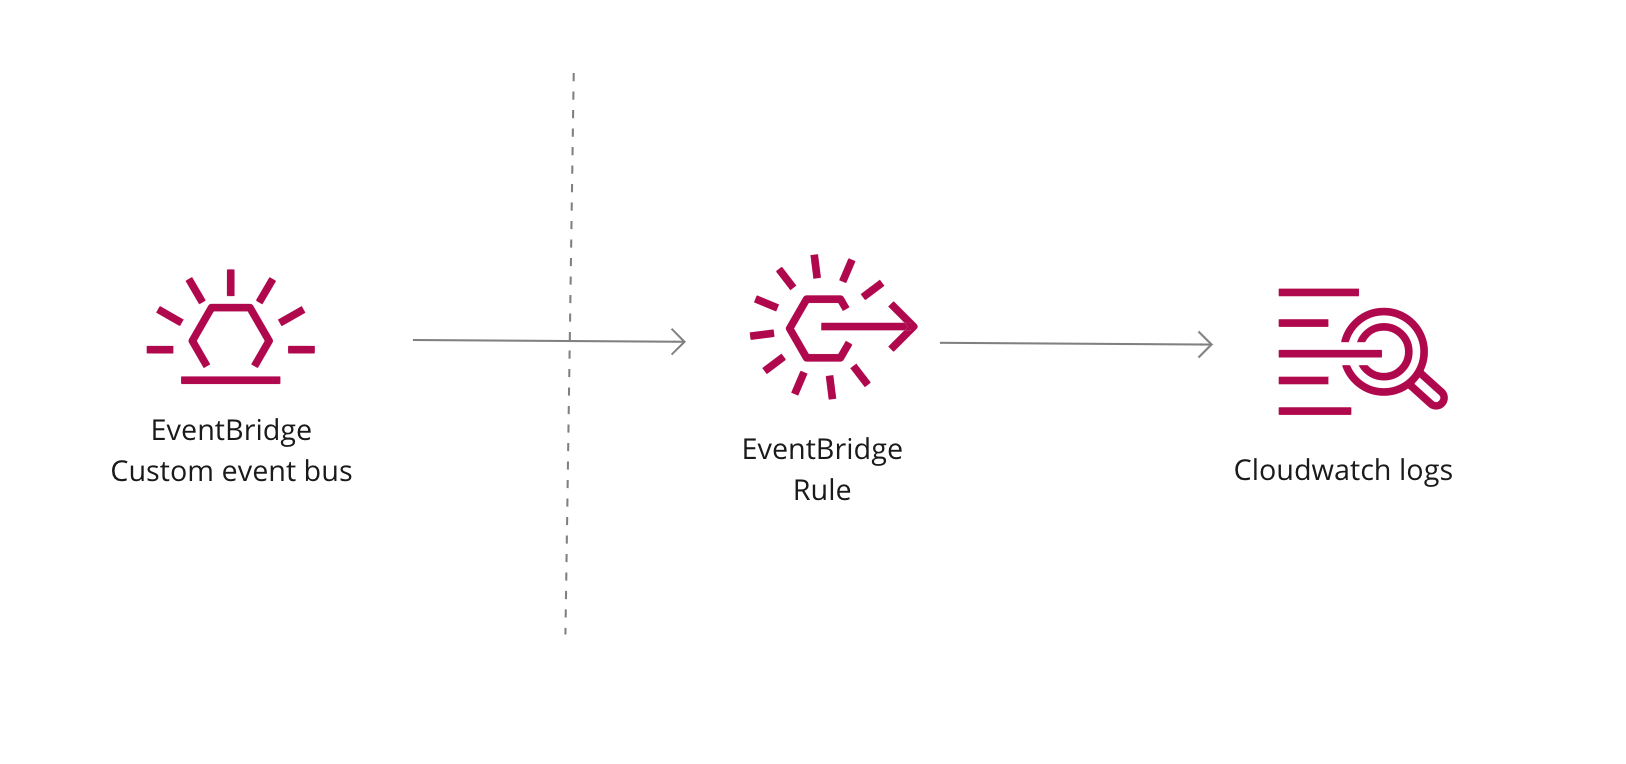
As of writing this post I have spent the last year using Amazon EventBridge to build and develop solutions within AWS.
Event Driven Architectures are awesome. They give us flexibility, agility and scalability.
Amazon EventBridge gives us some great utility when building Event Driven Architectures:
- Simplified vs SNS/SQS
- Content-based filtering
- Replay events
- Third party integrations (No webhooks!)
- And more...
One problem I have had with EventBridge is the ability to debug or visually see which events are being fired on an event bus.
Luckily for us with Eventbridge rules it is super easy for us to setup a rule for CloudWatch that allows us to see, debug and analyse our events from EventBridge.
In this guide we will cover:
- Setup a new EventBridge rule that points to CloudWatch for our events
- Examples of using CloudWatch Insights Logs to view data
Let's get started.
Setup EventBridge Rule with CloudWatch
When you build your Serverless architecture and integrations, its hard to verify that all parts of the system are working as intended.
But one quick way to start to debug and analyse is to setup CloudWach logs for our EventBridge events.
Let's dive in and setup our rule.
1. Setup the EventBridge Rule with CloudWatch Logs
First, let's setup a new EventBridge rule for our custom event bus.
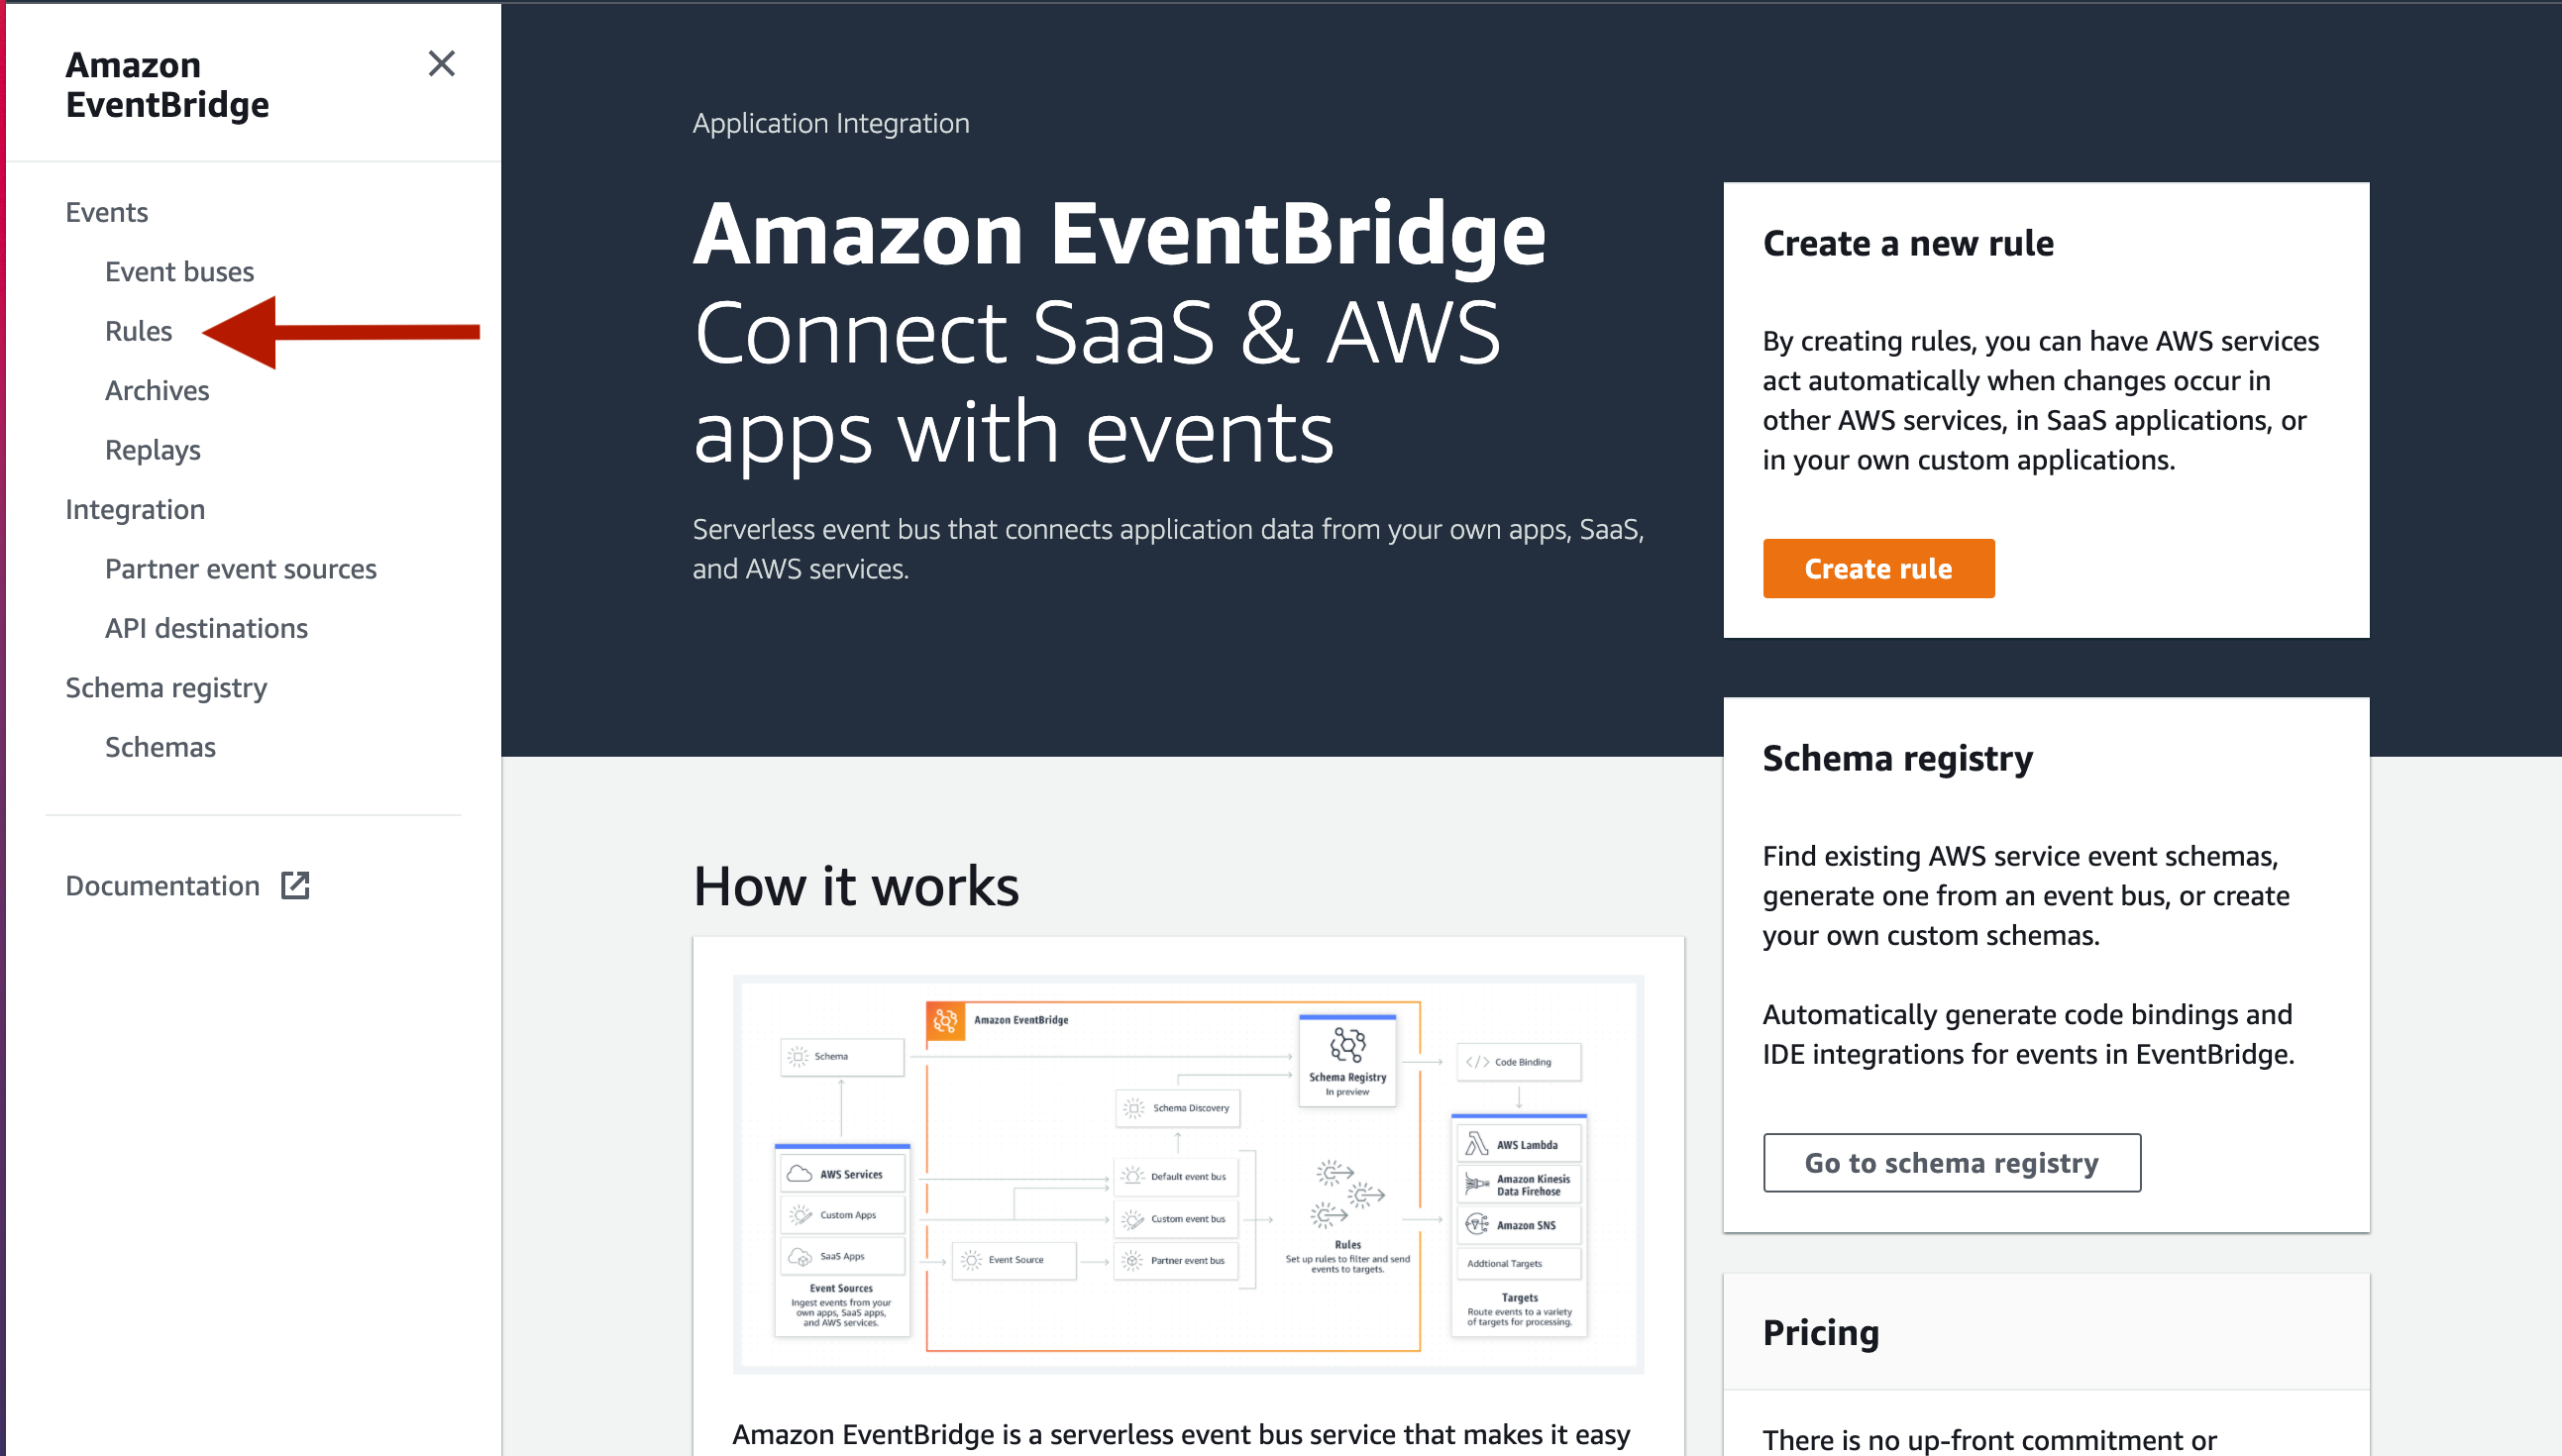
Amazon EventBridge: Create a new Rule
Next we want to create a new rule.
Lets call it eventbridge-logs and add any description you like.
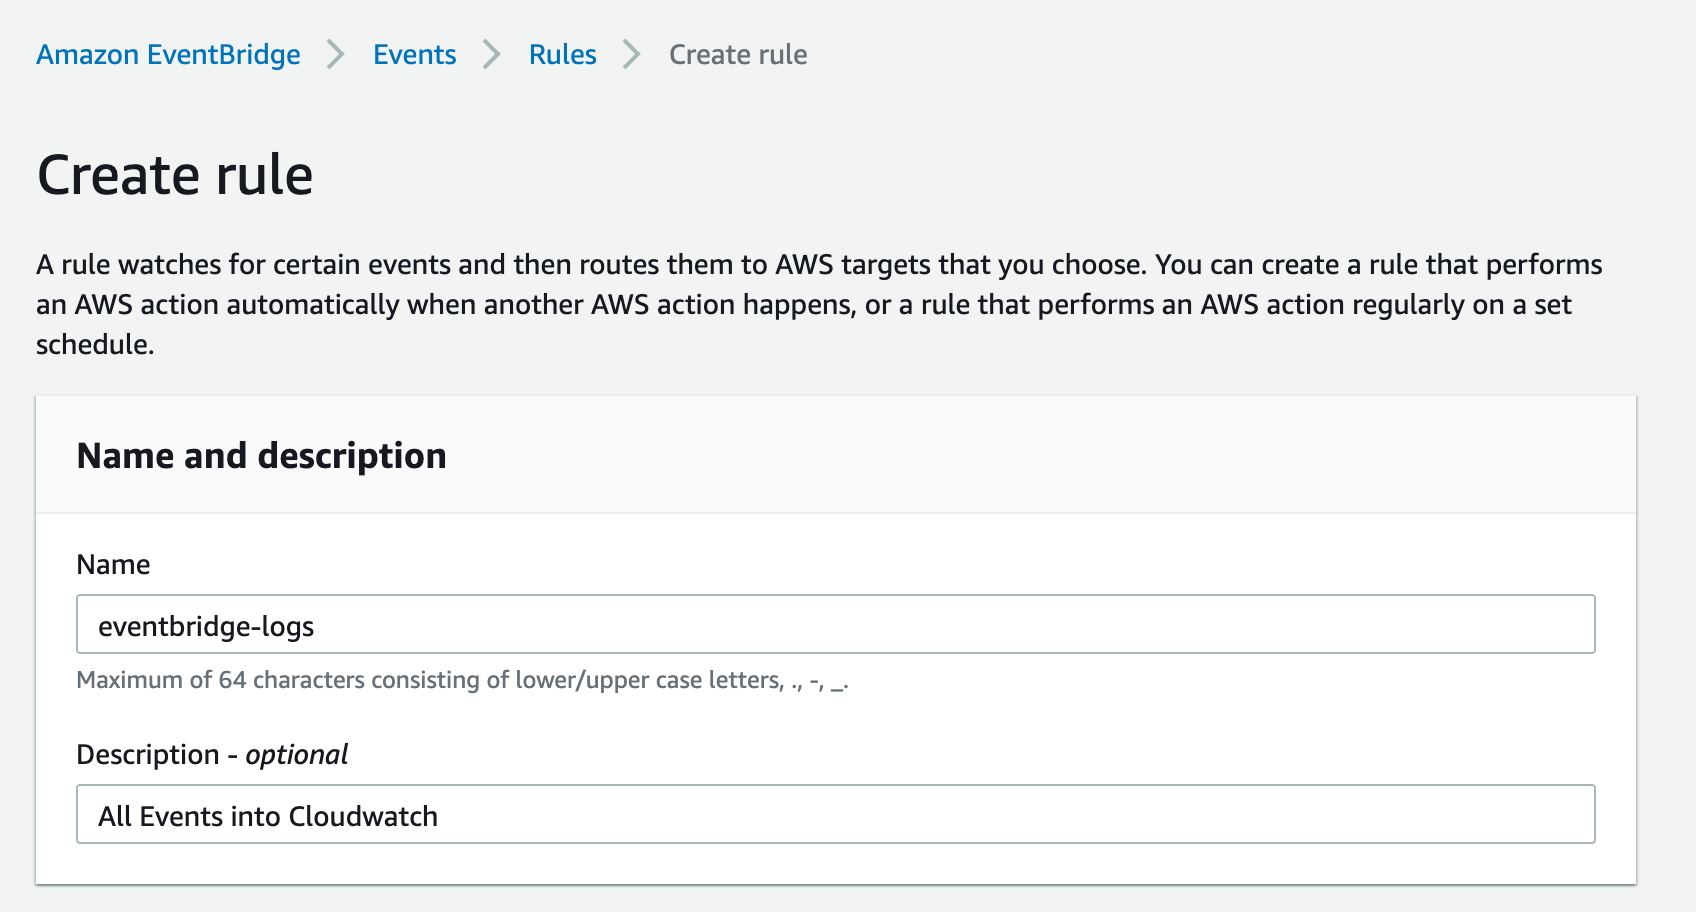
Amazon EventBridge: Creating a rule
Next we want to define a pattern for this new rule. Here we want to:
- Select a
Pre-defined pattern by service - Select
All Events
This rule will match all events going through our event bus.
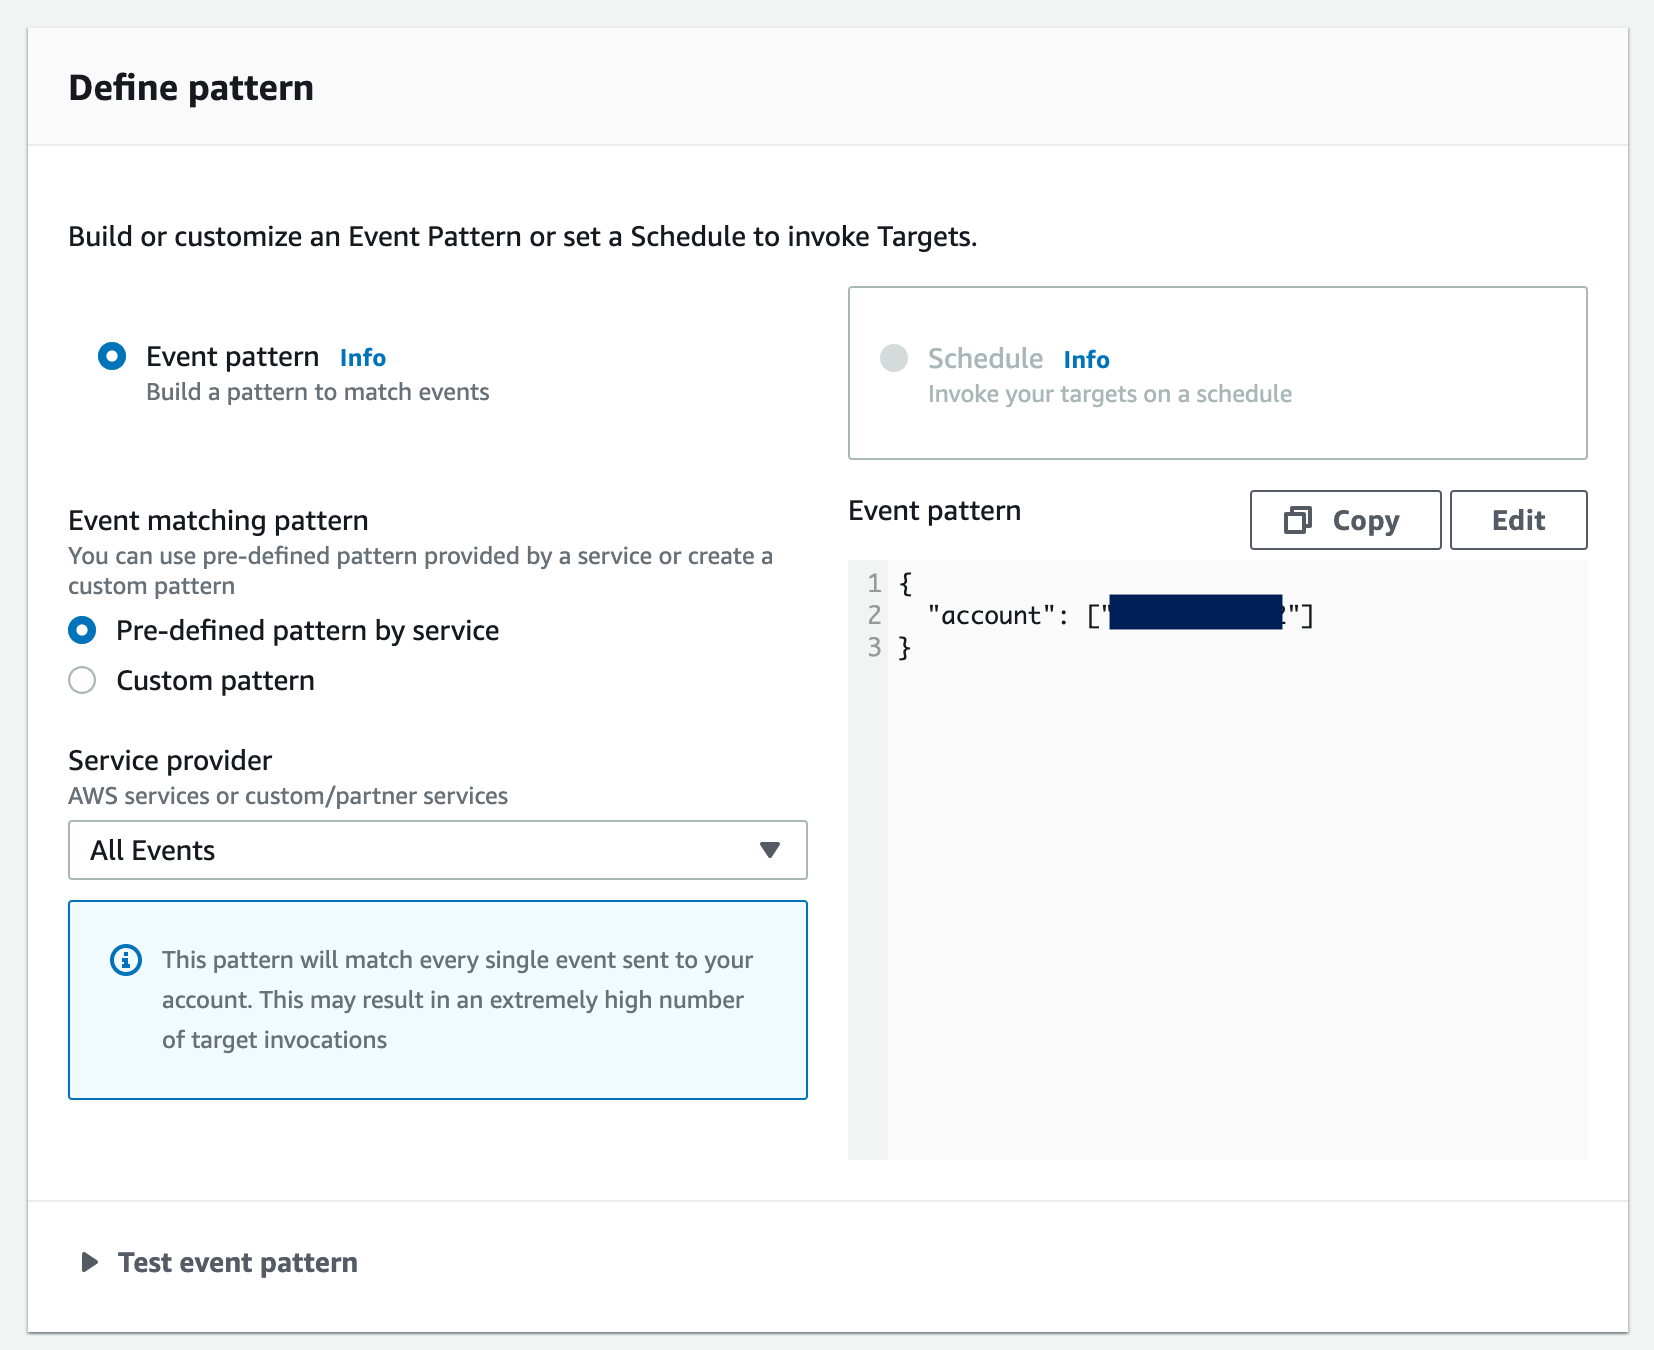
Amazon EventBridge: Defining a pattern for a new rule
Last thing we want to do here is set up our targets. You will want to:
- Select the event bus you are interested in
- Select the target rule to be
CloudWatch log groupand enter a new log group for this rule. (In this example we just useaws/events/eventbridge-logs).
Once you have done that, create the rule.
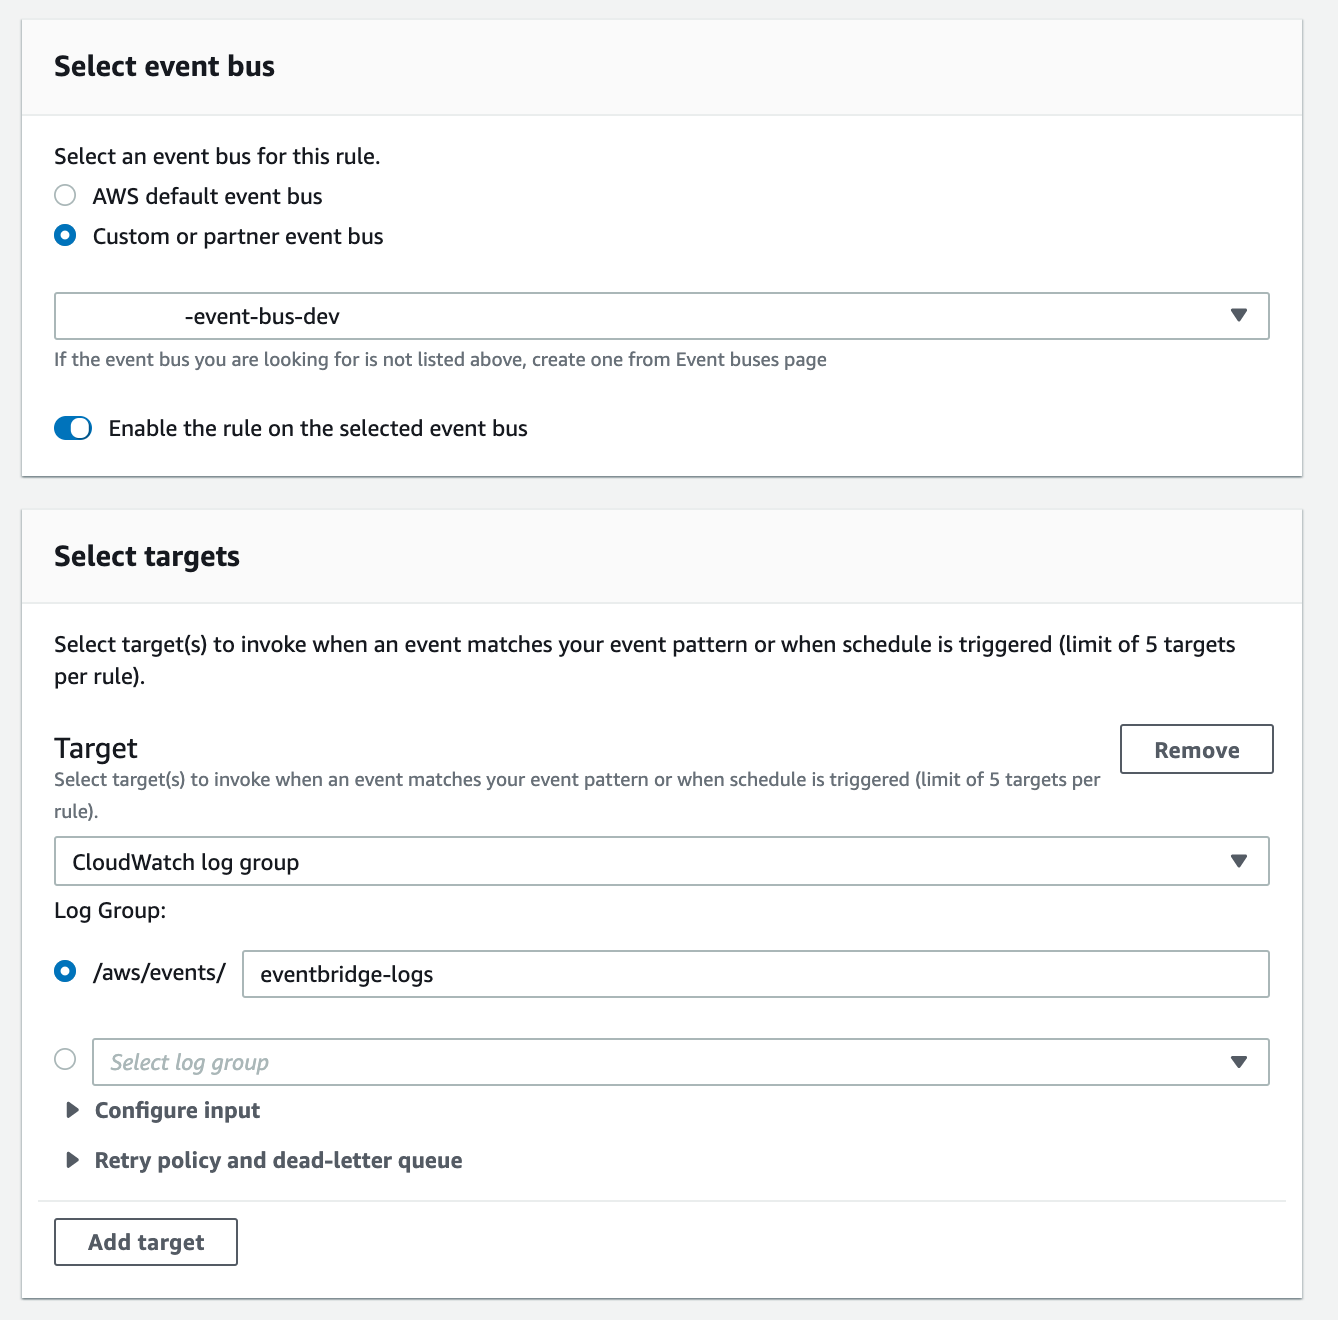
Amazon EventBridge: Setting up targets
Cool, so let's recap what we have done so far:
- We created a new EventBridge rule
- Our rule is configured to a custom event bus (or whichever you like)
- Our rule listens to all events and sends them to our new cloud watch log group
So now when events are raised on our selected event bus the rules will be displayed on the log group.
Exploring EventBridge Events in CloudWatch
Let's head over to CloudWatch Logs and look for our new LogGroup aws/events/eventbridge-logs.
💡 Assuming you have fired events through your event bus, we will start to see events being logged here.
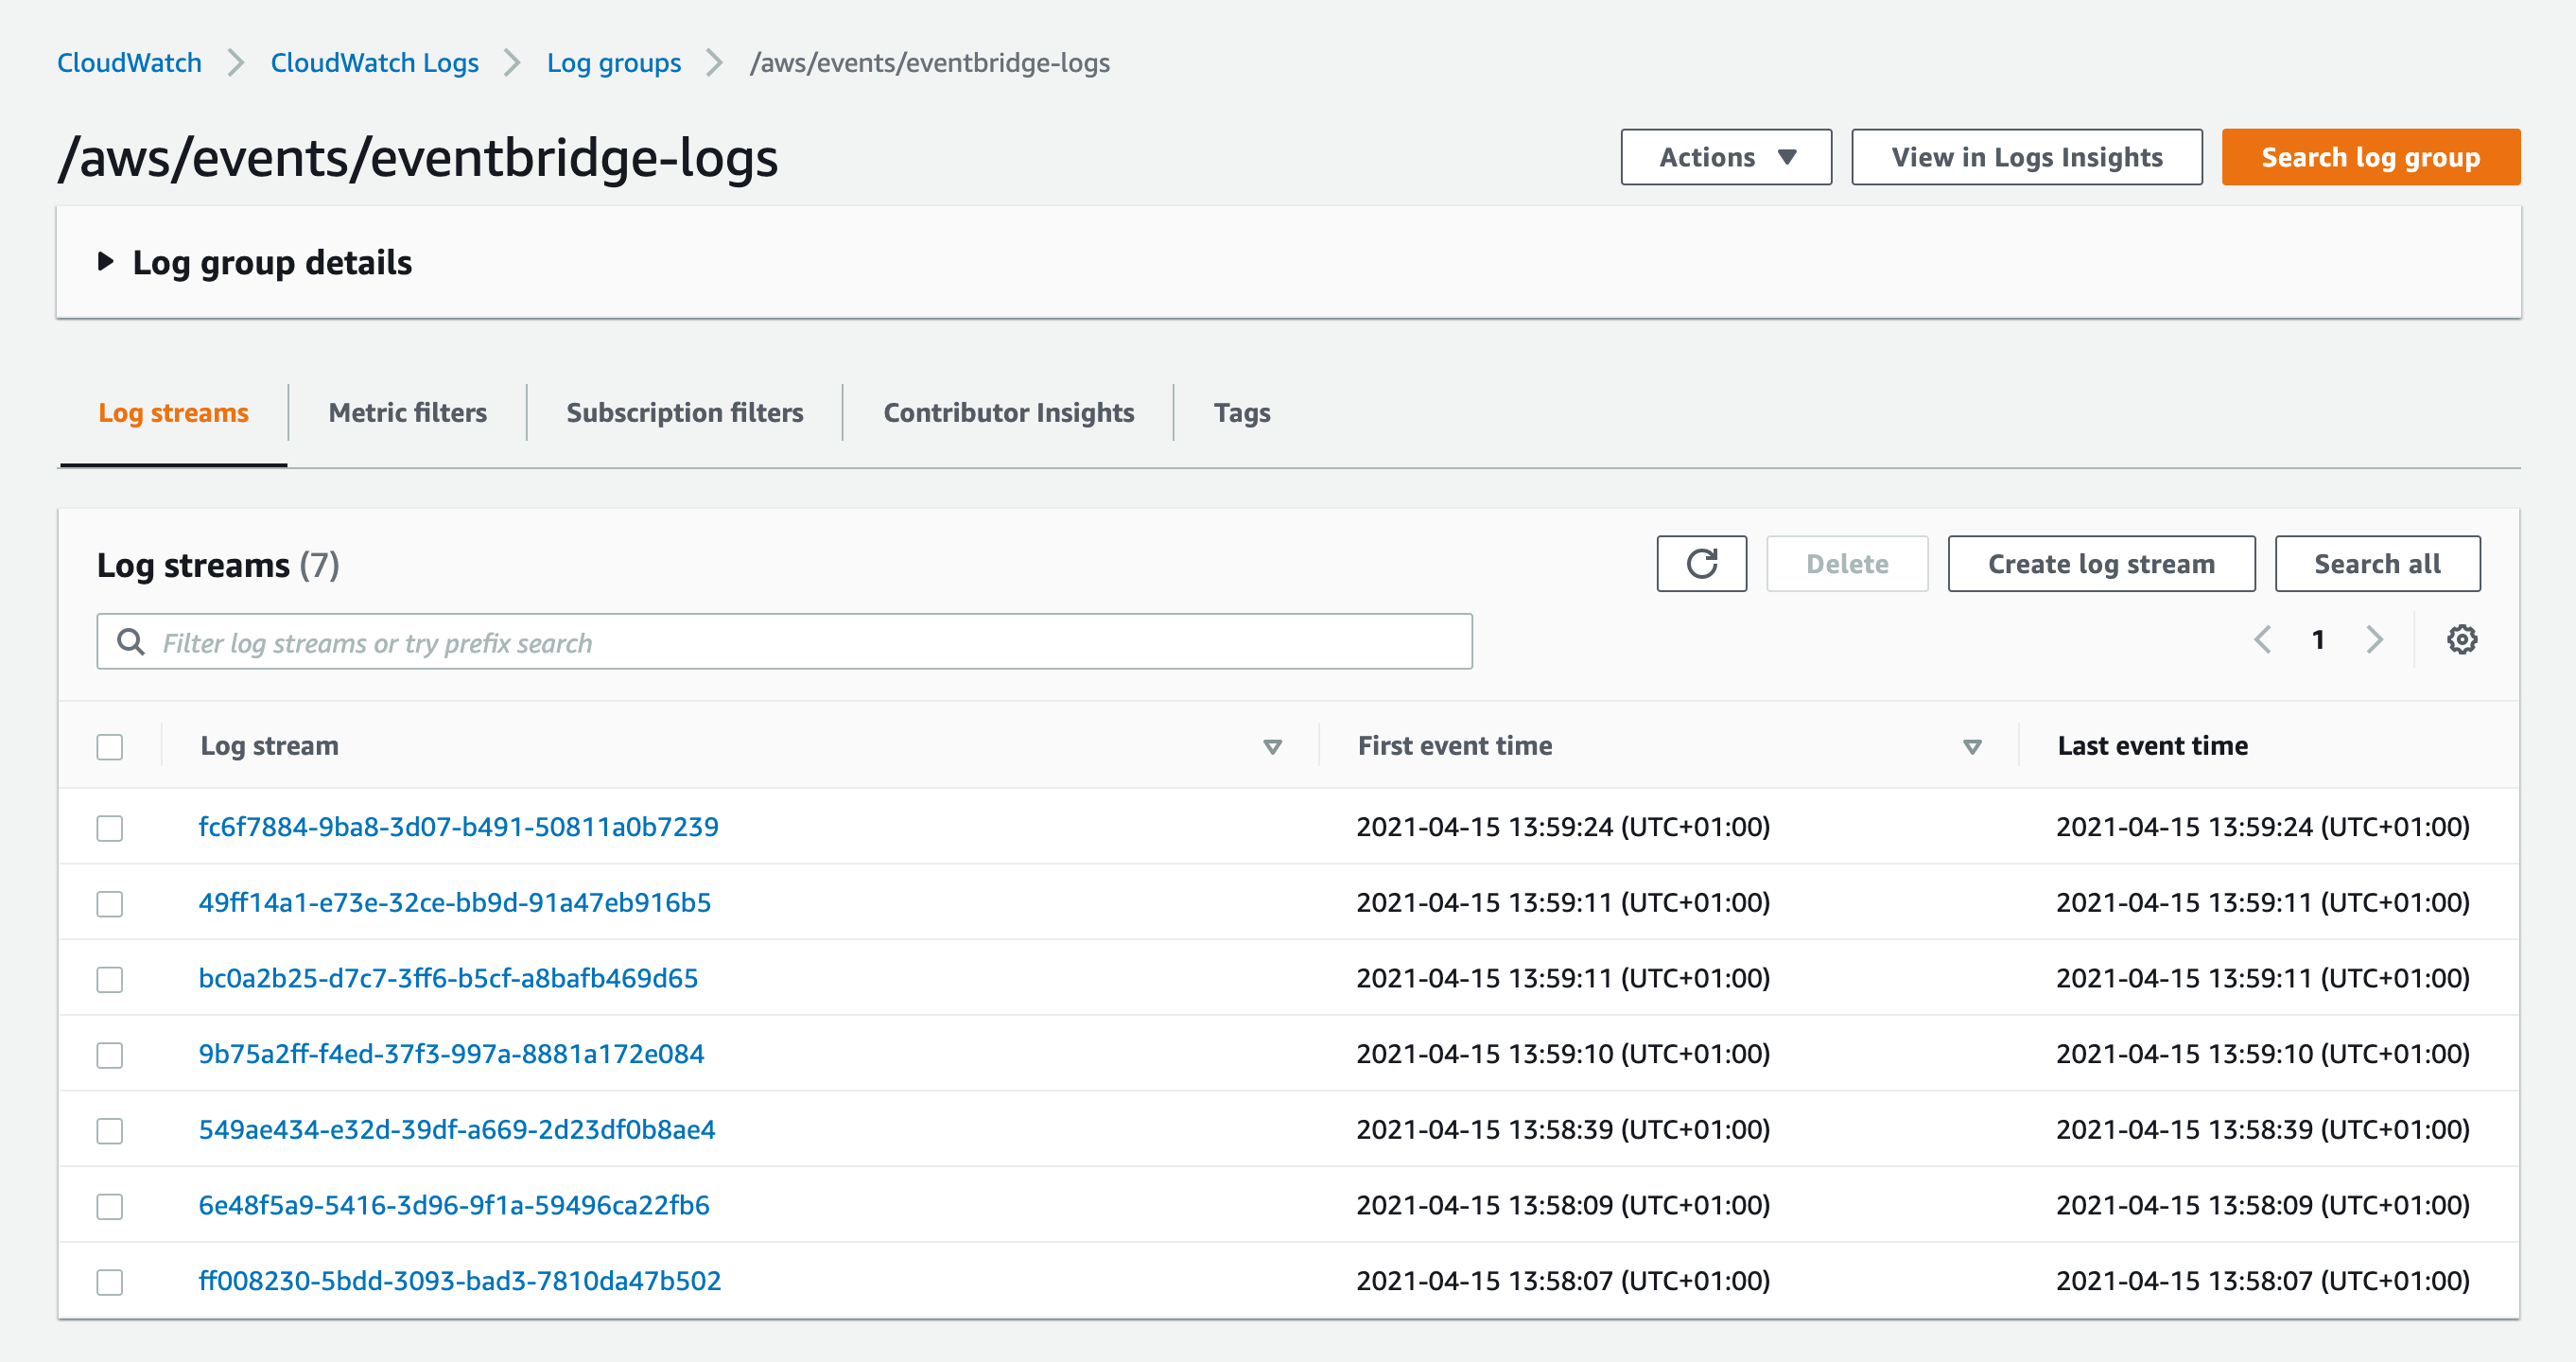
AWS CloudWatch: Viewing our new log group setup with EventBridge
Awesome. That's most of the work done!
Clicking on each entry in the log group will show us:
- When the event was created
- The account, region, source, detail-type and detail of the event.
Pretty useful if we want to debug or get some insight into our event bus! 💯
🔥 Remember by default our logs will remain in our log group forever. You might want to change your log retention period here.
👋 Let's Connect 👋
If you're doing any serverless work I would love to hear from you, be interested to know what your building and any experiences you would love to share!
Using Cloudwatch Log insights with EventBridge Events
Now we have some logs in our Log Group we can use CloudWatch insights to give us some extra information.
Here are some quick examples.
1. Counting the number of times our event goes through the event bus
If you want to know the number of events going through your bus, we can simply do a count of the events and group them by
the detail-type.
💡 Make sure you have our aws/events/eventbridge-logs selected
fields @timestamp, msg, `detail-type`
| stats count(*) as events by `detail-type`
| sort events desc
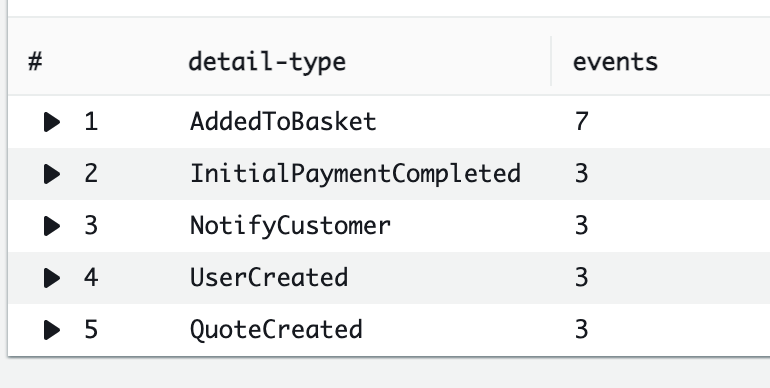
AWS Insights: Showing us how many events have been raised
This will show us how many events have been through our event bus. You could use this to match what you expect or filter down even more.
2. Find EventBridge events based on detail-type
This query will allow you to find all events based on detail-type
fields @timestamp, @message
| filter `detail-type` = "YOUR_DETAIL_TYPE_HERE"
| sort @timestamp desc
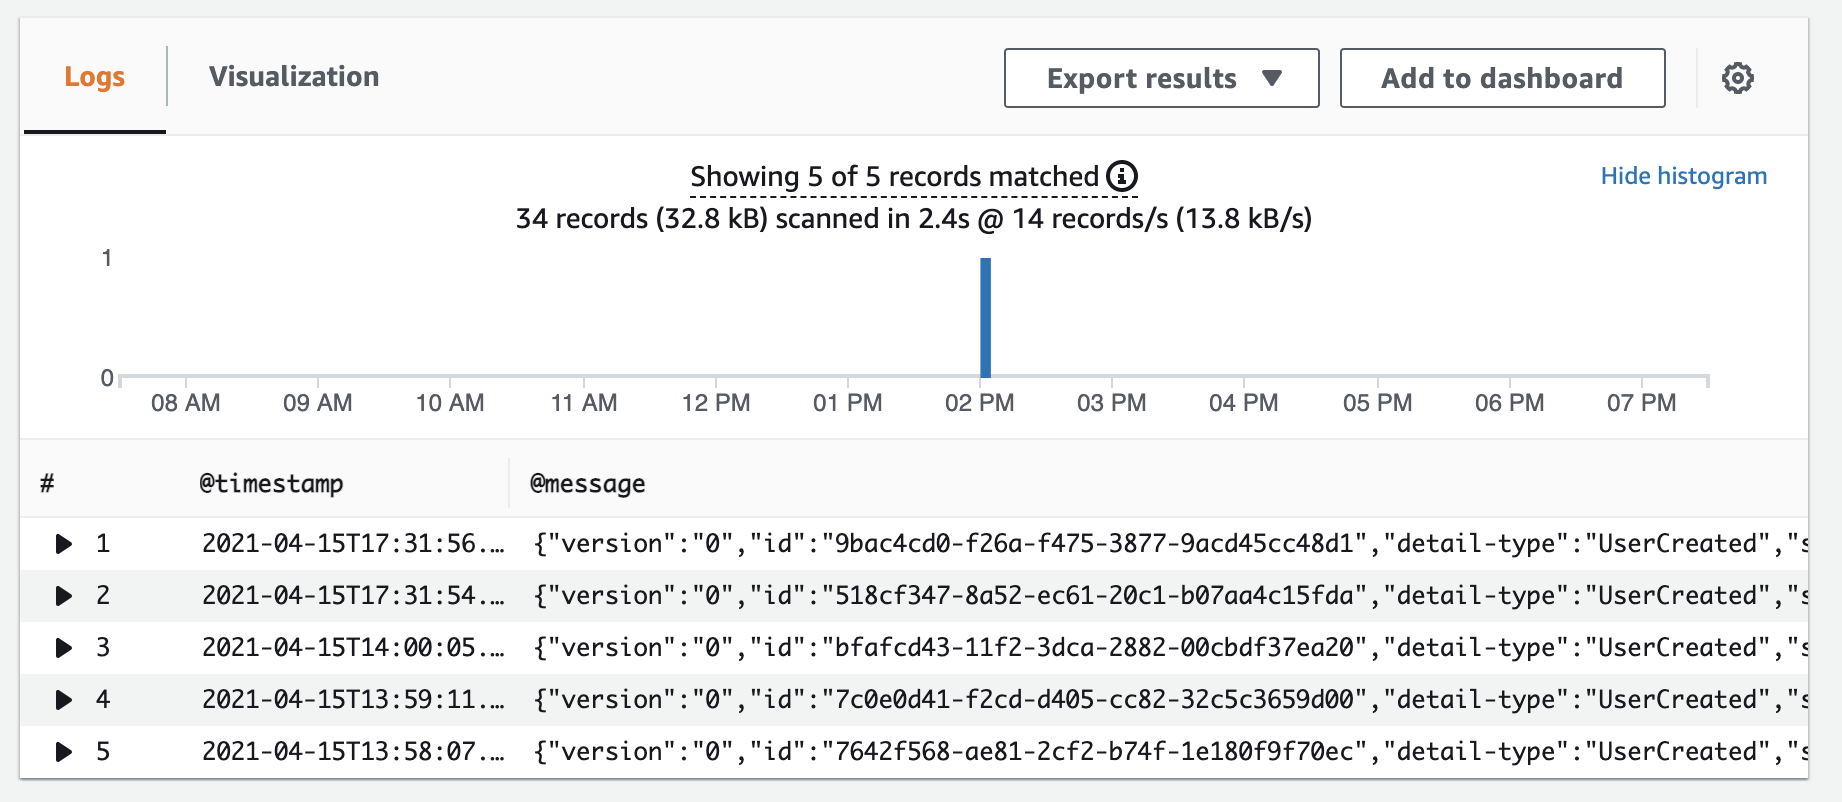
AWS Insights: Showing us events by detail-type
3. Find EventBridge events based on detail data
This query will allow us to filter any events based on the event payload (detail).
💡 In this example below let's imagine we have an event called UserCreated and on the detail we have the firstName of the user.
fields @timestamp, @message
| filter `detail-type` = 'UserCreated'
| filter `detail.firstName` = "Matthew"
| sort @timestamp desc

AWS Insights: Showing us events by detail data
These are just some basic examples of using CloudWatch Insights with EventBridge. If you have any other examples of use cases I would love to hear them.
Things to consider logging events into CloudWatch
Filtering Data before going to logs
Your events might have Personal Identity Information (PII) on them which you might not want to log. When you set up your rule you can simply use input transformers to filter out what data you want to be logged.
Costs for storing
Like most things it will cost you to keep this information in Cloudwatch.
•••Want to learn more Amazon EventBridge?
Get the EventBridge Book!
A guide to walk you through Amazon EventBridge with practical examples, use-cases and advanced patterns.
Summary
Amazon EventBridge is powerful.
It's ability to help us build decoupled and resilient architectures with rapid agility is great.
When we integrate other AWS services with EventBridge it can be quite difficult to see what's happening and debug our events.
Setting up a quick EventBridge rule into CloudWatch allows us to see all events going through which allows us to debug, filter and explore.
I hope this small guide helps you on your EventBridge journey and I would love to hear what you do to test or debug your events in EventBridge. Feel free to reach out.
If you found this post interesting or want to follow me on my serverless journey you can find me on Twitter

David Boyne
Maintainer EventCatalog | Advocate | Consultant | Enjoy learning things and sharing as I go.